by G. William Domhoff
This document presents details on the wealth and income distributions in the United States, and explains how we use these two distributions as power indicators. (...)
First, though, some definitions. Generally speaking, wealthis the value of everything a person or family owns, minus any debts. However, for purposes of studying the wealth distribution, economists define wealth in terms ofmarketable assets, such as real estate, stocks, and bonds, leaving aside consumer durables like cars and household items because they are not as readily converted into cash and are more valuable to their owners for use purposes than they are for resale (see Wolff, 2004, p. 4, for a full discussion of these issues). Once the value of all marketable assets is determined, then all debts, such as home mortgages and credit card debts, are subtracted, which yields a person's net worth. In addition, economists use the concept of financial wealth -- also referred to in this document as "non-home wealth" -- which is defined as net worth minus net equity in owner-occupied housing. As Wolff (2004, p. 5) explains, "Financial wealth is a more 'liquid' concept than marketable wealth, since one's home is difficult to convert into cash in the short term. It thus reflects the resources that may be immediately available for consumption or various forms of investments."
We also need to distinguish wealth from income. Income is what people earn from work, but also from dividends, interest, and any rents or royalties that are paid to them on properties they own. In theory, those who own a great deal of wealth may or may not have high incomes, depending on the returns they receive from their wealth, but in reality those at the very top of the wealth distribution usually have the most income. (But it's important to note that for the rich, most of that income does not come from "working": in 2008, only 19% of the income reported by the 13,480 individuals or families making over $10 million came from wages and salaries. See Norris, 2010, for more details.)
This document focuses on the "Top 1%" as a whole because that's been the traditional cut-off point for "the top" in academic studies, and because it's easy for us to keep in mind that we are talking about one in a hundred. But it is also important to realize that the lower half of that top 1% has far less than those in the top half; in fact, both wealth and income are super-concentrated in the top 0.1%, which is just one in a thousand. (To get an idea of the differences, take a look at an insider account by a long-time investment manager who works for the well-to-do and very rich. It nicely explains what the different levels have -- and how they got it. Also, David Cay Johnston (2011) has written a column about the differences among the top 1%, based on 2009 IRS information.)
(...)
So far there are only tentative projections -- based on the price of housing and stock in July 2009 -- on the effects of the Great Recession on the wealth distribution. They suggest that average Americans have been hit much harder than wealthy Americans. Edward Wolff, the economist we draw upon the most in this document, concludes that there has been an "astounding" 36.1% drop in the wealth (marketable assets) of the median household since the peak of the housing bubble in 2007. By contrast, the wealth of the top 1% of households dropped by far less: just 11.1%. So as of April 2010, it looks like the wealth distribution is even more unequal than it was in 2007. (See Wolff, 2010 for more details.)
There's also some general information available on median income and percentage of people below the poverty line in 2010. As might be expected, most of the new information shows declines; in fact, a report from the Center for Economic and Policy Research (2011) concludes that the decade from 2000 to 2010 was a "lost decade" for most Americans.
(...)
The Wealth Distribution
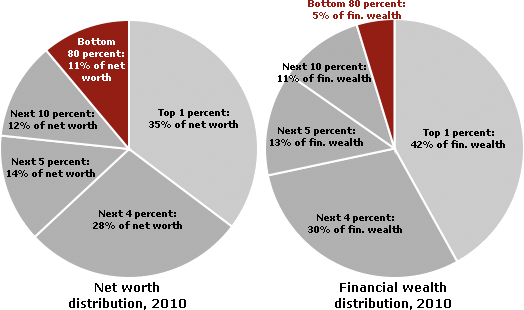
In the United States, wealth is highly concentrated in a relatively few hands. As of 2007, the top 1% of households (the upper class) owned 34.6% of all privately held wealth, and the next 19% (the managerial, professional, and small business stratum) had 50.5%, which means that just 20% of the people owned a remarkable 85%, leaving only 15% of the wealth for the bottom 80% (wage and salary workers). In terms of financial wealth (total net worth minus the value of one's home), the top 1% of households had an even greater share: 42.7%. Table 1 and Figure 1 present further details drawn from the careful work of economist Edward N. Wolff at New York University (2010).
| Table 1: Distribution of net worth and financial wealth in the |
| Total Net Worth | |||
|---|---|---|---|
| Top 1 percent | Next 19 percent | Bottom 80 percent | |
| 1983 | 33.8% | 47.5% | 18.7% |
| 1989 | 37.4% | 46.2% | 16.5% |
| 1992 | 37.2% | 46.6% | 16.2% |
| 1995 | 38.5% | 45.4% | 16.1% |
| 1998 | 38.1% | 45.3% | 16.6% |
| 2001 | 33.4% | 51.0% | 15.6% |
| 2004 | 34.3% | 50.3% | 15.3% |
| 2007 | 34.6% | 50.5% | 15.0% |
| Financial Wealth | |||
| Top 1 percent | Next 19 percent | Bottom 80 percent | |
| 1983 | 42.9% | 48.4% | 8.7% |
| 1989 | 46.9% | 46.5% | 6.6% |
| 1992 | 45.6% | 46.7% | 7.7% |
| 1995 | 47.2% | 45.9% | 7.0% |
| 1998 | 47.3% | 43.6% | 9.1% |
| 2001 | 39.7% | 51.5% | 8.7% |
| 2004 | 42.2% | 50.3% | 7.5% |
| 2007 | 42.7% | 50.3% | 7.0% |
Total assets are defined as the sum of: (1) the gross value of owner-occupied housing; (2) other real estate owned by the household; (3) cash and demand deposits; (4) time and savings deposits, certificates of deposit, and money market accounts; (5) government bonds, corporate bonds, foreign bonds, and other financial securities; (6) the cash surrender value of life insurance plans; (7) the cash surrender value of pension plans, including IRAs, Keogh, and 401(k) plans; (8) corporate stock and mutual funds; (9) net equity in unincorporated businesses; and (10) equity in trust funds.
Total liabilities are the sum of: (1) mortgage debt; (2) consumer debt, including auto loans; and (3) other debt. From Wolff (2004, 2007, & 2010).
| Figure 1: Net worth and financial wealth distribution in the |
 |
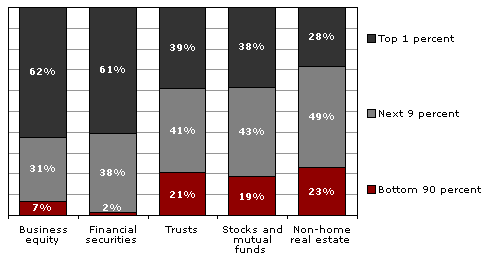
In terms of types of financial wealth, the top one percent of households have 38.3% of all privately held stock, 60.6% of financial securities, and 62.4% of business equity. The top 10% have 80% to 90% of stocks, bonds, trust funds, and business equity, and over 75% of non-home real estate. Since financial wealth is what counts as far as the control of income-producing assets, we can say that just 10% of the people own the United States of America.
| Table 2: Wealth distribution by type of asset, 2007 |
| Investment Assets | |||
|---|---|---|---|
| Top 1 percent | Next 9 percent | Bottom 90 percent | |
| Business equity | 62.4% | 30.9% | 6.7% |
| Financial securities | 60.6% | 37.9% | 1.5% |
| Trusts | 38.9% | 40.5% | 20.6% |
| Stocks and mutual funds | 38.3% | 42.9% | 18.8% |
| Non-home real estate | 28.3% | 48.6% | 23.1% |
| TOTAL investment assets | 49.7% | 38.1% | 12.2% |
| Housing, Liquid Assets, Pension Assets, and Debt | |||
| Top 1 percent | Next 9 percent | Bottom 90 percent | |
| Deposits | 20.2% | 37.5% | 42.3% |
| Pension accounts | 14.4% | 44.8% | 40.8% |
| Life insurance | 22.0% | 32.9% | 45.1% |
| Principal residence | 9.4% | 29.2% | 61.5% |
| TOTAL other assets | 12.0% | 33.8% | 54.2% |
| Debt | 5.4% | 21.3% | 73.4% |
| From Wolff (2010). | |||
| Figure 2a: Wealth distribution by type of asset, 2007: |
 |
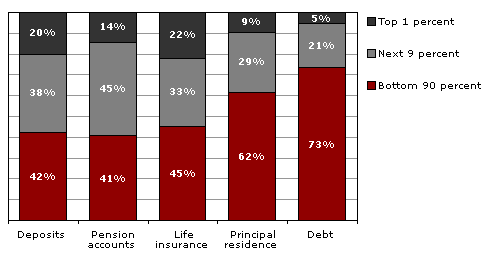
| Figure 2b: Wealth distribution by type of asset, 2007: |
 |
| Table 3: Share of wealth held by the Bottom 99% and Top 1% in the |
| Bottom 99 percent | Top 1 percent | |
|---|---|---|
| 1922 | 63.3% | 36.7% |
| 1929 | 55.8% | 44.2% |
| 1933 | 66.7% | 33.3% |
| 1939 | 63.6% | 36.4% |
| 1945 | 70.2% | 29.8% |
| 1949 | 72.9% | 27.1% |
| 1953 | 68.8% | 31.2% |
| 1962 | 68.2% | 31.8% |
| 1965 | 65.6% | 34.4% |
| 1969 | 68.9% | 31.1% |
| 1972 | 70.9% | 29.1% |
| 1976 | 80.1% | 19.9% |
| 1979 | 79.5% | 20.5% |
| 1981 | 75.2% | 24.8% |
| 1983 | 69.1% | 30.9% |
| 1986 | 68.1% | 31.9% |
| 1989 | 64.3% | 35.7% |
| 1992 | 62.8% | 37.2% |
| 1995 | 61.5% | 38.5% |
| 1998 | 61.9% | 38.1% |
| 2001 | 66.6% | 33.4% |
| 2004 | 65.7% | 34.3% |
| 2007 | 65.4% | 34.6% |
Sources: 1922-1989 data from Wolff (1996). 1992-2007 data from Wolff (2010).
(...)
Here are some dramatic facts that sum up how the wealth distribution became even more concentrated between 1983 and 2004, in good part due to the tax cuts for the wealthy and the defeat of labor unions: Of all the new financial wealth created by the American economy in that 21-year-period, fully 42% of it went to the top 1%. A whopping 94% went to the top 20%, which of course means that the bottom 80% received only 6% of all the new financial wealth generated in the United States during the '80s, '90s, and early 2000s (Wolff, 2007).
(...)
댓글 없음:
댓글 쓰기